Hologram simulation
Holograms can be simulated using the method described by Lichte et al. [LL08] The simulator includes simulation of holograms with Gaussian and Poisson noise, without effect of Fresnel fringes of the biprism. The simulator requires amplitude and phase images being provided. Those can be calculated as in example below in which for amplitude a sphere is assumed, the same sphere is used for the mean inner potential (MIP) contribution to the phase and in addition to the quadratic long-range phase shift originating from the centre of the sphere:
import numpy as np
import matplotlib.pyplot as plt
from libertem_holo.base.generate import hologram_frame

# Define grid
sx, sy = (256, 256)
mx, my = np.meshgrid(np.arange(sx), np.arange(sy))
# Define sphere region
sphere = (mx - 33.)**2 + (my - 103.)**2 < 20.**2
# Calculate long-range contribution to the phase
phase = ((mx - 33.)**2 + (my - 103.)**2) / sx / 40.
# Add mean inner potential contribution to the phase
phase[sphere] += (-((mx[sphere] - 33.)**2 \
                   + (my[sphere] - 103.)**2) / sx / 3 + 0.5) * 2.
# Calculate amplitude of the phase
amp = np.ones_like(phase)
amp[sphere] = ((mx[sphere] - 33.)**2 \
               + (my[sphere] - 103.)**2) / sx / 3 + 0.5

# Plot
f, ax = plt.subplots(1, 2)
ax[0].imshow(amp, cmap='gray')
ax[0].title.set_text('Amplitude')
ax[0].set_axis_off()
ax[1].imshow(phase, cmap='viridis')
ax[1].title.set_text('Phase')
ax[1].set_axis_off()
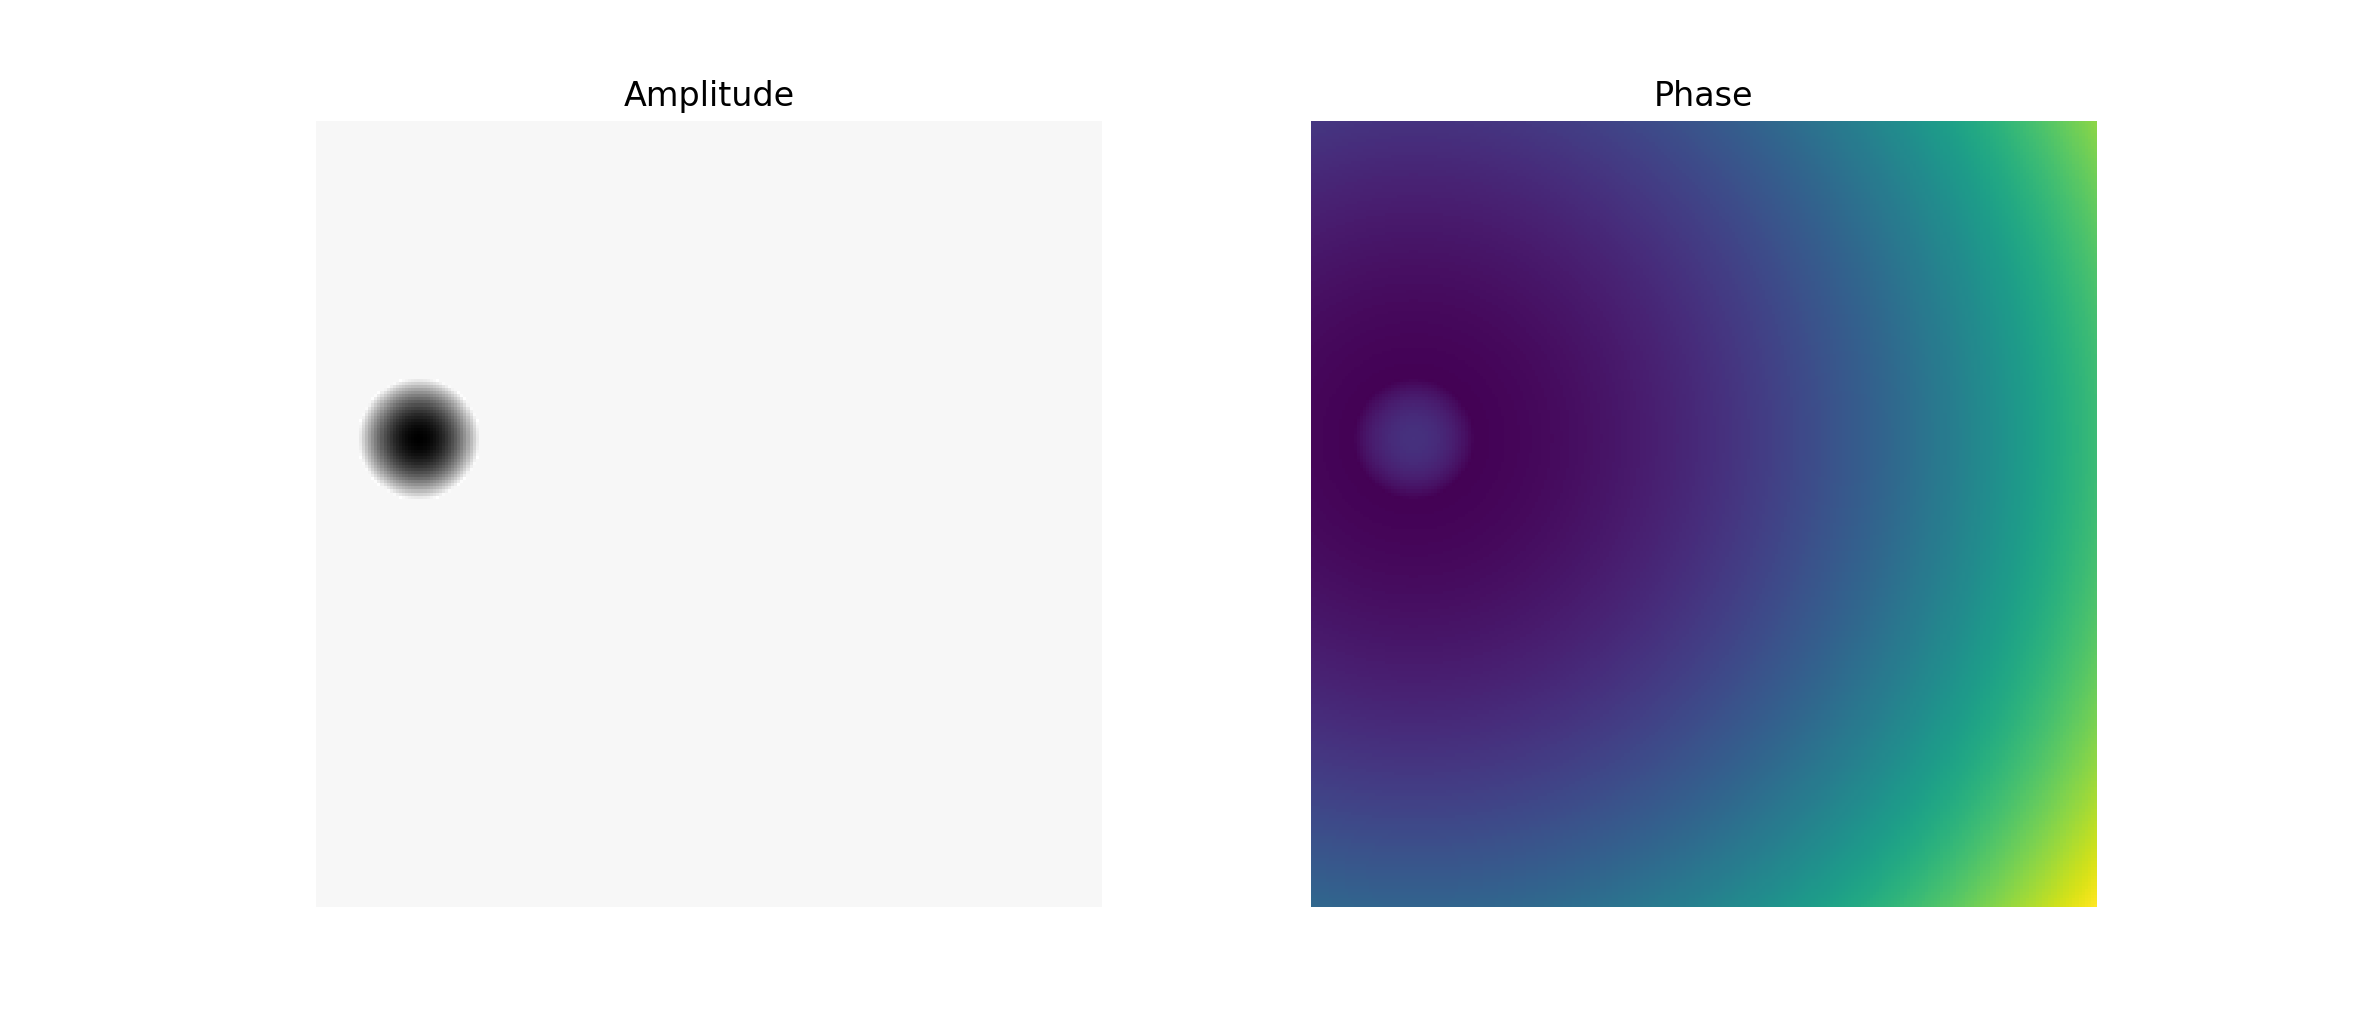
To generate the object hologram, amp and phase should be passed to the holo_frame
function as follows:
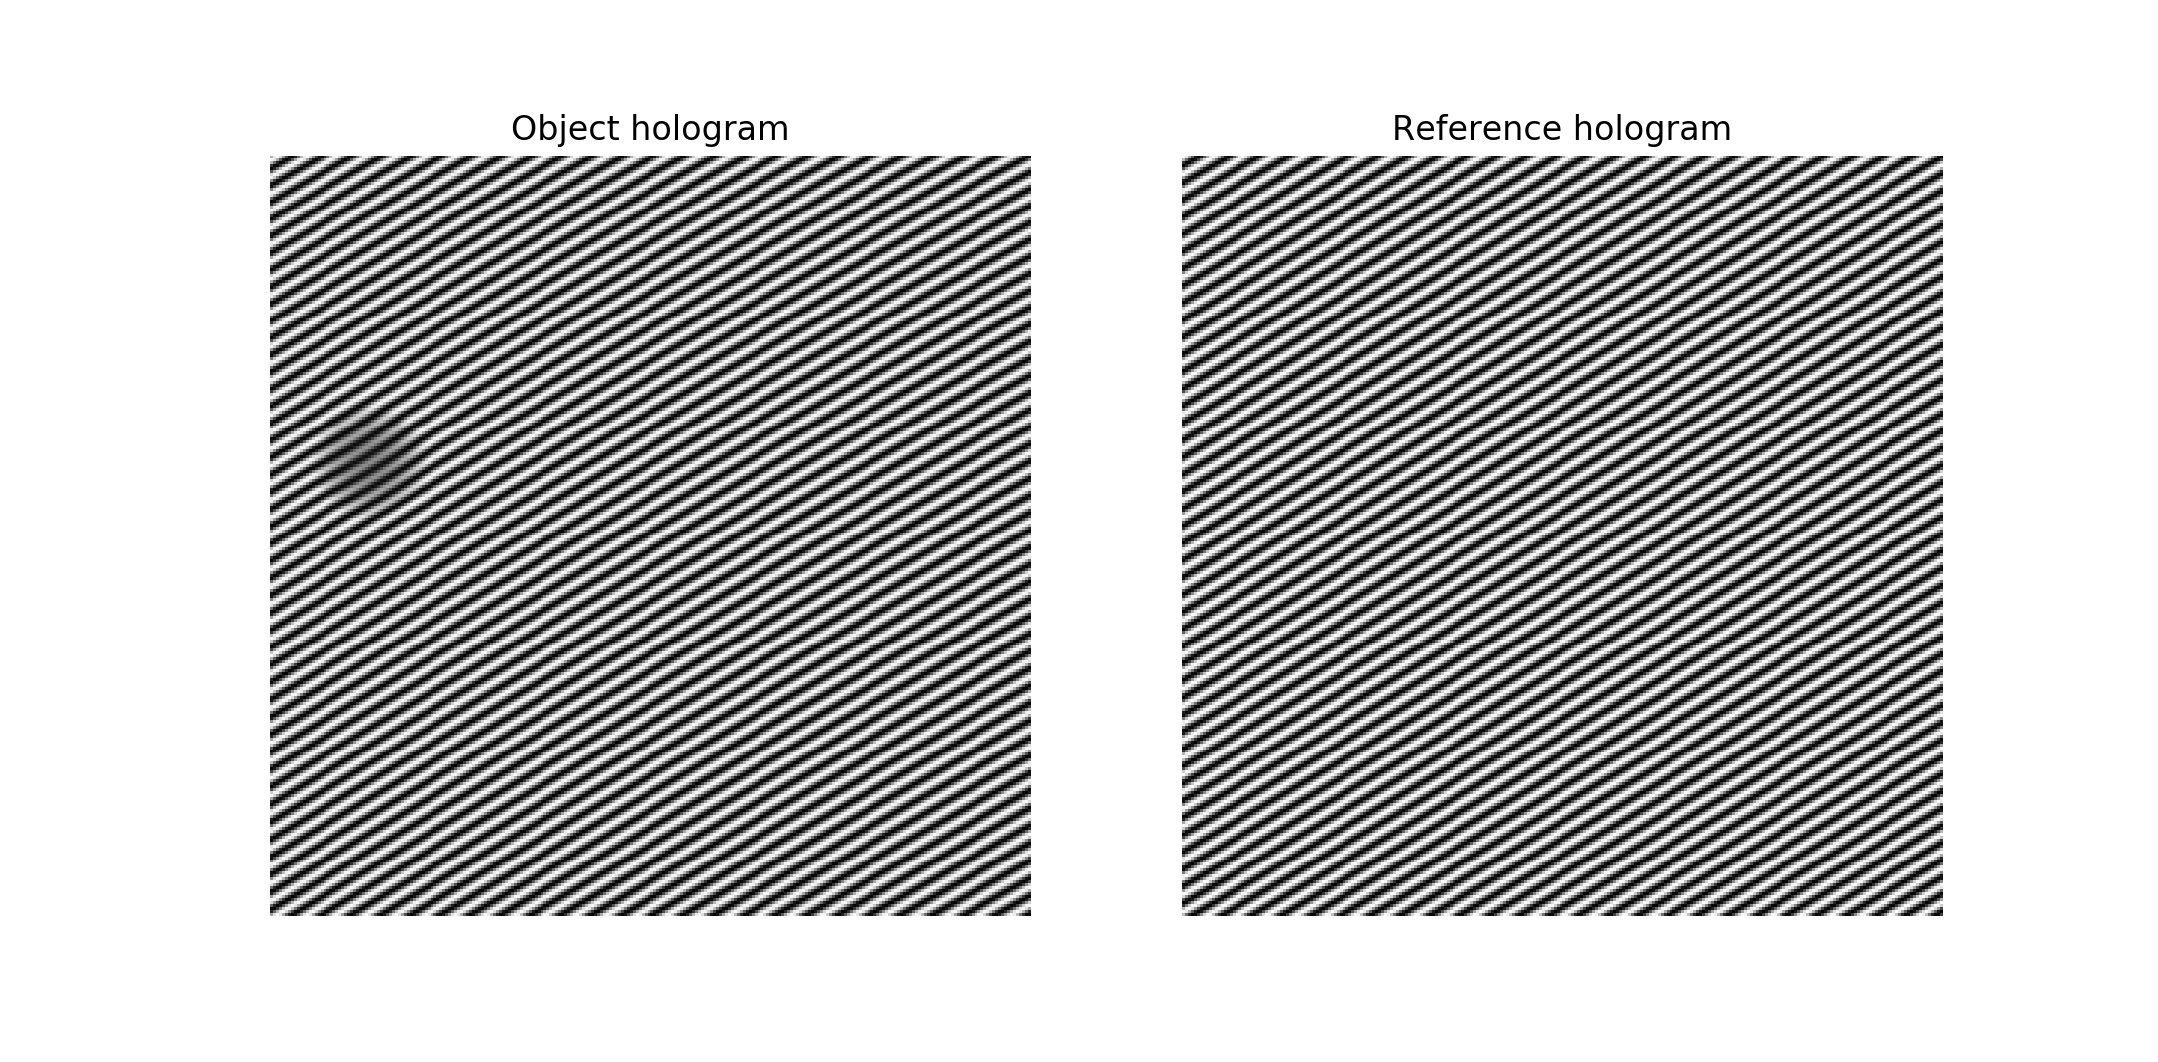
holo = hologram_frame(amp, phase)
To generate the vacuum reference hologram, use an array of ones for amplitude and zero for phase:
ref = hologram_frame(np.ones_like(phase), np.zeros_like(phase))

# Plot
f, ax = plt.subplots(1, 2)
ax[0].imshow(holo, cmap='gray')
ax[0].title.set_text('Object hologram')
ax[0].set_axis_off()
ax[1].imshow(ref, cmap='gray')
ax[1].title.set_text('Reference hologram')
ax[1].set_axis_off()